Stata Level-1: Fundamentals of Data Analysis
Stata is a general-purpose statistical software package created in 1985 by StataCorp. Most of its users work in research, especially in the fields of economics, sociology, political science, biomedicine, and epidemiology. Explore more about Stata: https://www.stata.com/learn.
What you'll learn
- An essential introduction to Stata
- Data analysis in Stata
- Fast, and to the point, useful tips to use in Stata
- Programming
- Statistics
- Data manipulation in Stata
- Download and installation
- Dataset preparation
- Dataset management
- Log and DO file
- Article writing and result preparation
- Data visualization
Who this course is for
- Anyone wanting to work with Stata
- Data analysts
- Data scientists
- Quantitative degree students
- University students
- Computer Science graduate
- Economists, Social Scientists, Political Scientists, Biostatisticians, and other disciplines
- Those wanting to skill-up in Stata
Requirements
- Basic computer knowledge
- Basic idea about command line
- Statistical knowledge
- Some basic quantitative knowledge
This course includes
- 13 live and interactive sessions
- Course materials
- Article writing with JaeTech Researcher
- Interative learning platform
- 2 hours of each sessions
- Able to apply statistical techniques in your project
- Real life project development
- Certificate of completion
Session outline
- Stata introduction
- Download
- Step by step installation procedure
- Learn about windows menus and operations
- Familiar with command line
- Data management
- Raw dataset preparation
- Dataset import on data using menu and command line
- Importing excel data
- Learn about data types
- Variables and
- Operators
- Learn about Log file and how to save it
- DO file and it’s importance
- Appending your existing dataset with new dataset
- Merging two or multiple datasets
- Grouping your data variables
- How to write article or manuscript
- Structure of a Public Health manuscript
- How to select Journal
- Learn about descriptions stats
- Cross tabulation
- Frequency table
- One way table
-
Histograms
-
Box plots
-
Quantile plots
-
Bar graphs
-
Pie charts
-
Dot charts
-
Scatter plots
-
Lines of best fit
-
Area plots
-
Line plots
-
Range plots
-
Table plots
- Mean
- Median
- Mode
- Percentile
- Quartile
- Range
- Variance
- Standar Deviation
- Statistical test – One simple proportion
- t-Test
- ANNOVA
- Chi-Squared
- Correlation
- Hypothesis testing
- Dealing with continuous and discreet variables
- Fit Linear regression
- Dealing with categorical variable
- Perform Logistic regression
Course Enrolment
- Date will be announced soon
- Registration link: Will open soon
- Course fee: Will announce soon
Are you curious?

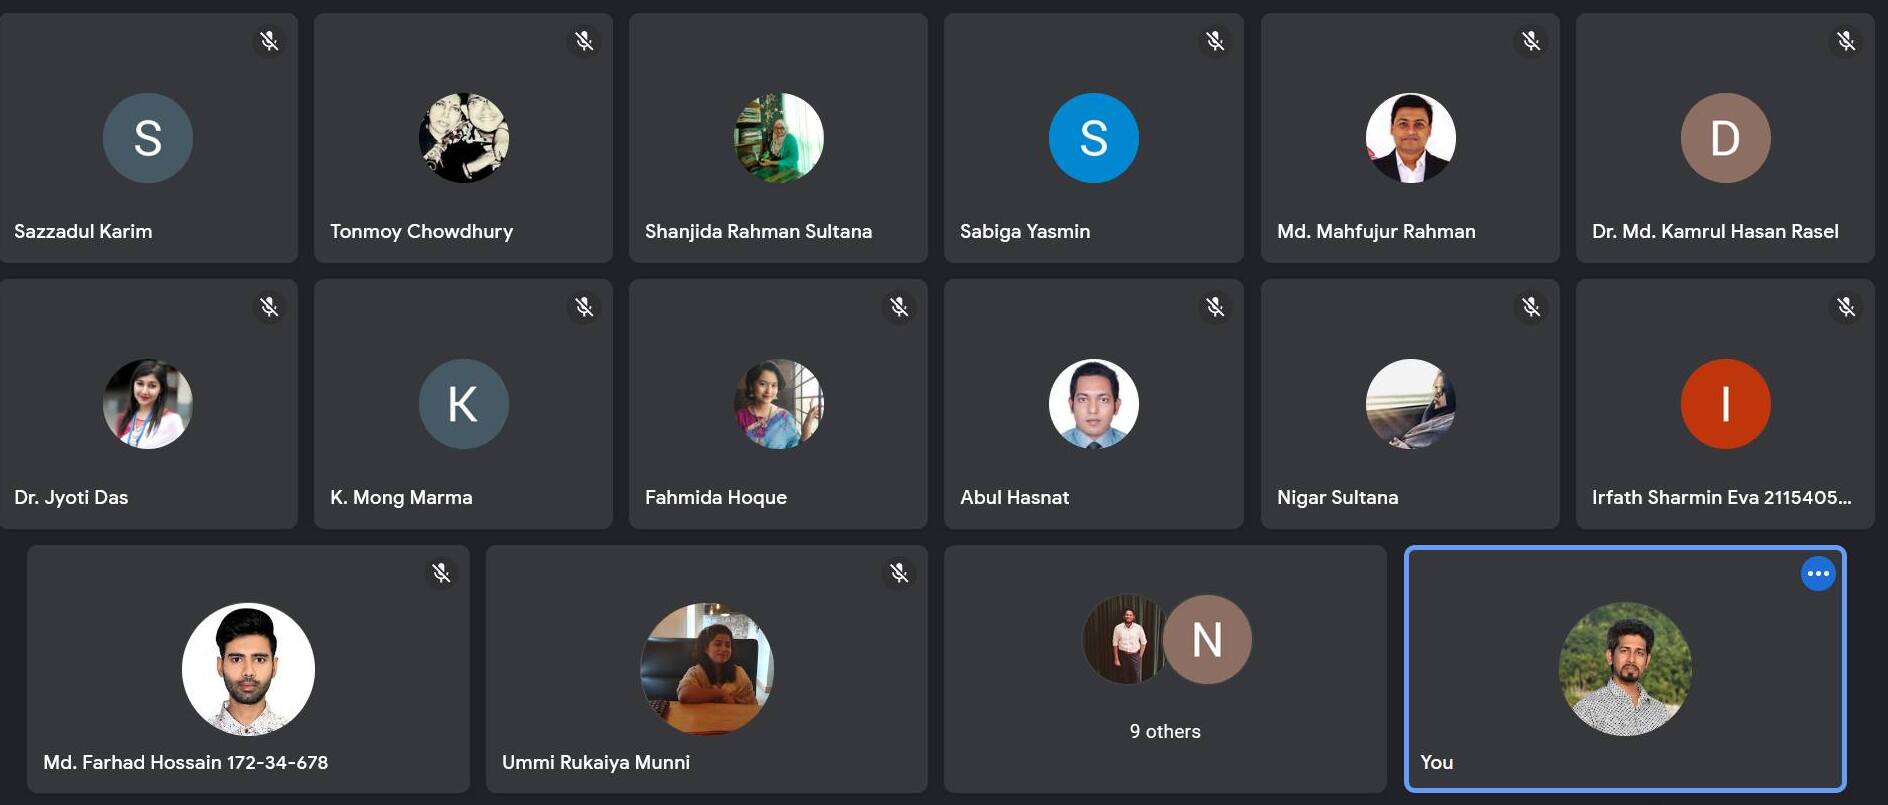
Previous Sessions

0 Comments

